
 Post by
In today's data-driven business environment, organizations rely on Business Intelligence (BI) dashboards to transform complex financial data into meaningful insights. Financial reporting is no longer limited to spreadsheets and static reports. Modern BI dashboards provide interactive visualizations, real-time analytics, and automated reporting, enabling finance teams to make faster, more informed decisions. By consolidating data from multiple sources into a single platform, BI dashboards help organizations improve accuracy, transparency, and overall financial performance.
A well-designed financial dashboard provides executives, accountants, and financial analysts with a comprehensive overview of key business metrics. Instead of manually gathering data from various systems, decision-makers can instantly monitor revenue, expenses, profit margins, cash flow, budgets, and financial forecasts through intuitive charts, graphs, and performance indicators. This real-time visibility enables businesses to identify trends, detect potential risks, and respond quickly to changing market conditions.
One of the most valuable BI dashboards for financial reporting is the Executive Financial Dashboard. This dashboard provides senior management with a high-level summary of the organization's financial health by displaying key performance indicators (KPIs) such as total revenue, net profit, operating expenses, return on investment (ROI), and year-over-year growth. Executives can quickly assess business performance and make strategic decisions based on accurate financial insights. Another essential dashboard is the Cash Flow Dashboard, which helps organizations monitor incoming and outgoing cash. Maintaining healthy cash flow is critical for business sustainability, and this dashboard enables finance teams to track operating cash, investment activities.

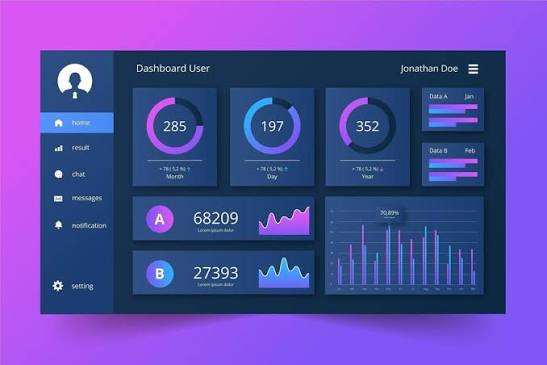
The Budget vs. Actual Dashboard is widely used to compare planned budgets with actual financial performance. By highlighting variances across departments, projects, or business units, organizations can identify areas where spending exceeds expectations or where cost-saving opportunities exist. This dashboard supports better financial planning, accountability, and resource allocation throughout the organization.Profitability analysis is another important aspect of financial reporting.
The Profit and Loss (P&L) Dashboard provides detailed insights into revenue, cost of goods sold, operating expenses, gross profit, and net income. Finance managers can analyze profitability across products, services, customers, or business locations, enabling data-driven strategies to improve overall business performance.
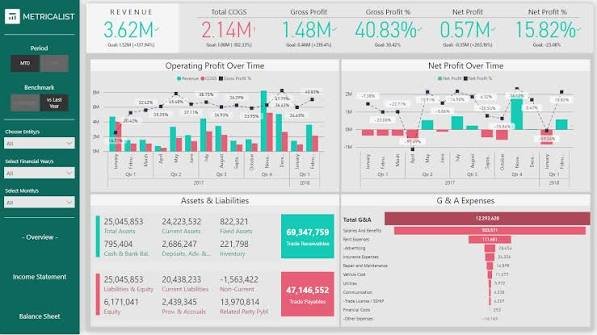
Accounts receivable and accounts payable dashboards also play a crucial role in financial management. These dashboards help organizations monitor outstanding customer payments, supplier invoices, payment due dates, and collection efficiency. Timely tracking of receivables and payables improves working capital management and strengthens overall financial stability.Modern BI platforms also support financial forecasting dashboards, which use historical data, predictive analytics, and machine learning algorithms to estimate future revenue, expenses, and cash flow. Accurate forecasting enables businesses to prepare for market fluctuations, optimize investments, and make long-term strategic decisions with greater confidence.Interactive data visualization is one of the greatest advantages of BI dashboards. Users can drill down into specific financial metrics, filter reports by department or time period, and generate customized reports without requiring advanced technical expertise. This flexibility allows decision-makers at every level of the organization to access the financial information most relevant to their responsibilities.
Did You Know?
Many organizations have significantly reduced the time required to prepare financial reports by using Business Intelligence dashboards. Automated data integration and real-time reporting allow finance teams to spend less time compiling reports and more time analyzing business performance.
Fun Fact:
Modern BI dashboards can process millions of financial records in seconds, transforming raw data into interactive charts, KPIs, and visual reports that help executives make faster and more informed business decisions.